
Zoom / Pixel / A–B / Histogram / Range
Read pixel values. Inspect edges and artefacts.
Examine suspect areas with zoom, colour and brightness readouts, and an A–B signal profile. HDRmaster helps you investigate overshoot, noise and level discontinuities so you can identify the next grading or encoding correction.
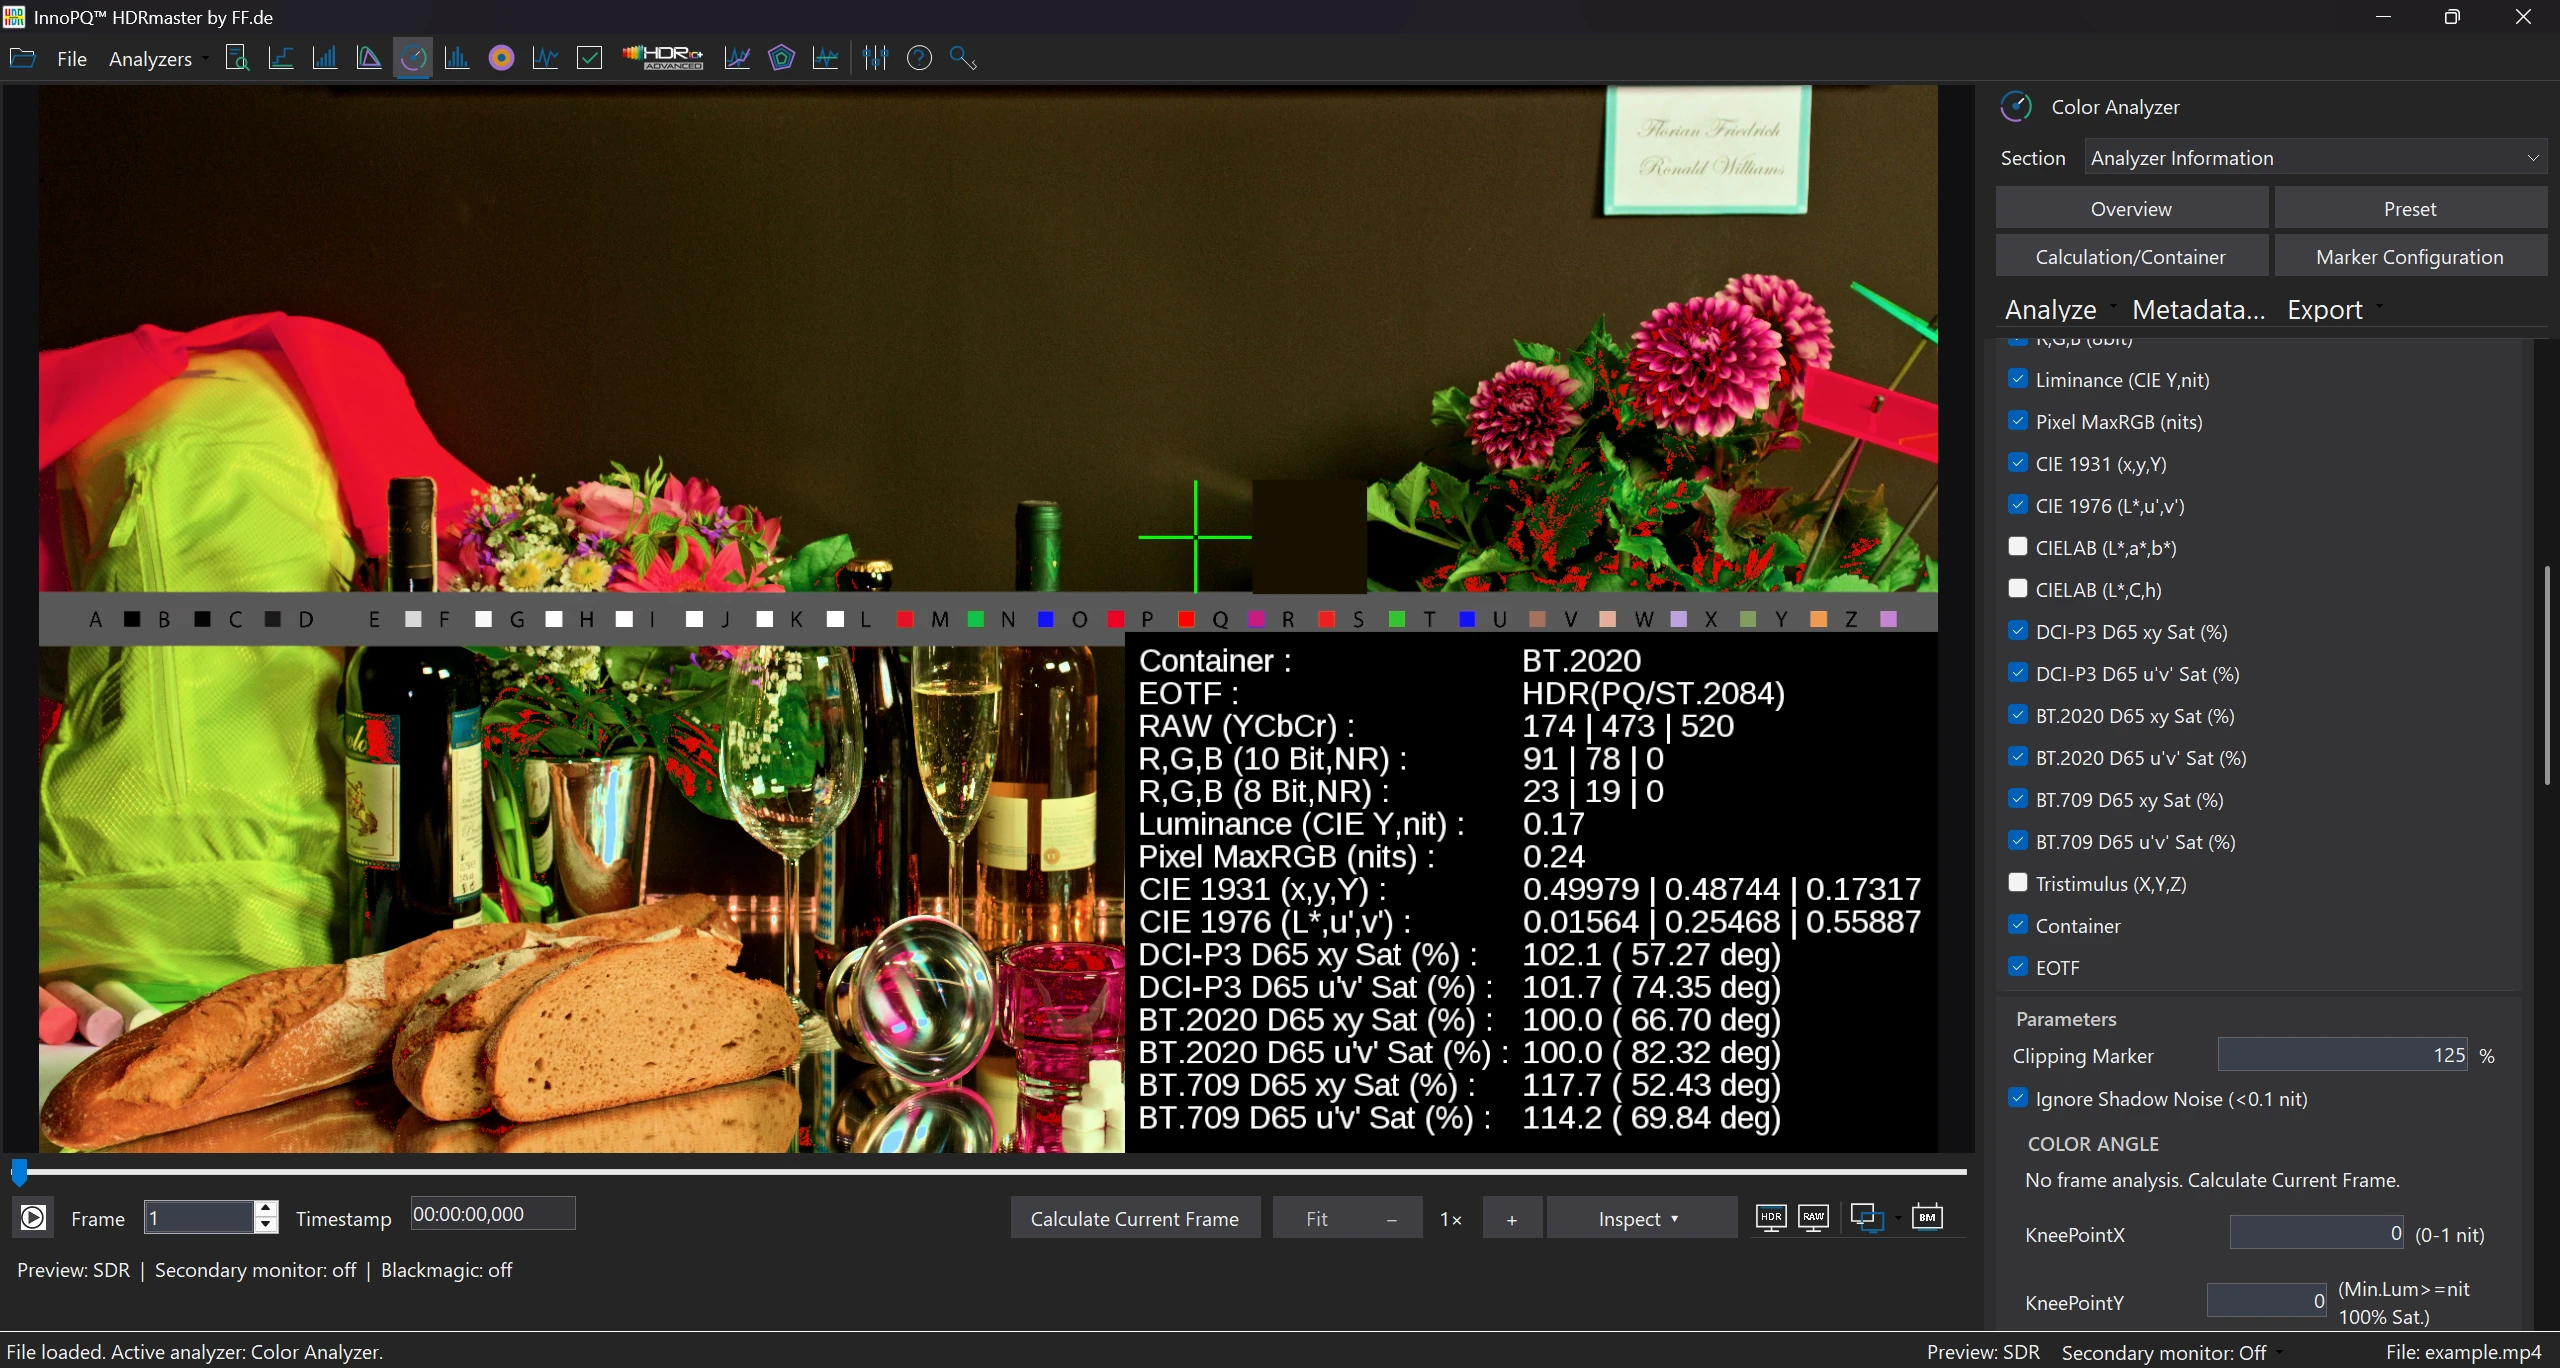
In this screenshot
- 0.17 nits / 0.24 nits
- Luminance Y and MaxRGB for the same selected pixel.
- 102.1% DCI-P3 D65 xy Sat
- The displayed saturation belongs to a dark pixel. Brightness and saturation can be assessed together.
What causes the visible issue?
At a hard edge, a noisy shadow or an unusual highlight, numerical readouts complement visual inspection. They show what is already present in the decoded file.
Select a pixel, compare neighbouring values and draw an A–B line across the transition. The profile reveals level changes and possible overshoot; the histogram helps assess the wider brightness distribution.
Follow the workflow
Investigate an affected image area.
Choose a frame and a useful zoom
Select the frame and enlarge the affected area. The frame readout and pixel position identify it in the file.
Read the pixel at the selected position
Check coordinates, units and signal interpretation. Compare nearby pixels rather than relying on a single isolated readout.
Draw an A–B line across the feature
Inspect the signal profile across the edge or transition. Look for a level change or overshoot and relate it to the actual image positions.
Read the histogram in a defined range
Select the image region and examine the distribution of shadows, diffuse whites and highlights.
Use Inspector findings as a prompt
Compare automated hints with source signalling, interpretation and actual values. Open the relevant frame or metadata when a warning needs explanation.
Zoom: Fit → 2× → Fit
Recorded zoom steps, edited into a short sequence.
Read the video transcript
The Color Analyzer shows the frame fitted to the window, at 2× after the zoom action, and fitted again. The three recorded views are edited into a short sequence.
Pixel readout in the Color Analyzer
Animated detail view of a software screenshot.
Read the video transcript
This screen tour uses editorial zoom to guide attention across the original detail-inspection view. Locate the source frame, then read the pixel and analysis areas. The movement belongs to the presentation of the screenshot.
Inspect local detail and brightness distribution.
The A–B profile plots the signal across the selected edge. Use it to investigate ringing or overshoot and assess the effects of sharpening and encoding.
The histogram shows how shadows, diffuse whites and highlights are distributed. For range checks, also compare file signalling with the decoded values.
Inspector automatically flags inconsistencies such as a mismatch between metadata and signal levels. This helps focus manual review on the relevant properties.
Result
Actionable findings for grading, encoding and QC.
Document the affected frame, pixel positions and A–B profile. These values help justify a correction and compare the revised file afterwards.
Depending on the analysis tool, image, CSV and report outputs let you share the affected area and its values with the next production stage.
The next step
Return to the peak analysis if the feature drives a maximum, or inspect the preview path if the question is about the way the display presents the source.
Requirements & licenceCommon questions
HDRmaster questions
Does zoom change the analysed source values?
Zoom is a viewing aid. Read the numerical source values with their coordinates and interpretation; do not estimate them from the scaled picture.
What does the A–B profile show?
It shows the signal along the selected line. Use it to investigate transitions, edges and possible overshoot, with the endpoints kept in view.
Can a histogram tell me the correct range by itself?
No. Compare the file signalling, interpretation and decoded values. A histogram is one part of that assessment.
Does every Inspector warning mean the file is defective?
No. A warning is a prompt for a targeted review. Inspect the relevant values, metadata and frame before deciding what to change.
Licence & included tools
HDRmaster with Gamut Rings OFX.
Use HDRmaster to analyse video signals, inspect colour and create static and dynamic HDR metadata. Gamut Rings OFX is included for colour-gamut investigation in DaVinci Resolve.
- Windows software for one active computer per licence
- Transfer activation by deactivating the previous computer
- New versions are currently free of charge
- Order Choose your billing country and payment method in the Digistore24 checkout. Review the final price and purchase terms.
- Download After payment is received, open your delivery link and save the installer and licence key.
- Activate Install on your Windows workstation and activate your licence. Contact FF Pictures for questions about your setup.
799 EUR net
One-time purchase · one active workstation
Applicable taxes and the final total are shown in the Digistore24 checkout for your billing country.
Buy HDRmasterDigistore24
After payment is received, Digistore24 provides the software download and licence key. The checkout currently allows five downloads within three months of payment. Keep the installer, order details and licence key for later use.
You are ordering through Digistore24. The checkout shows availability for your billing country and the applicable purchase and return terms. For multiple licences or company procurement, contact FF Pictures.
Discuss my workflow or company order →